Join 50,000+ teams across 100+ countries
Upgrade your meetings now.
Two-minute setup. Free forever foundation. Enterprise-grade from day one. Turn meetings into a positive and rewarding experience
.avif)
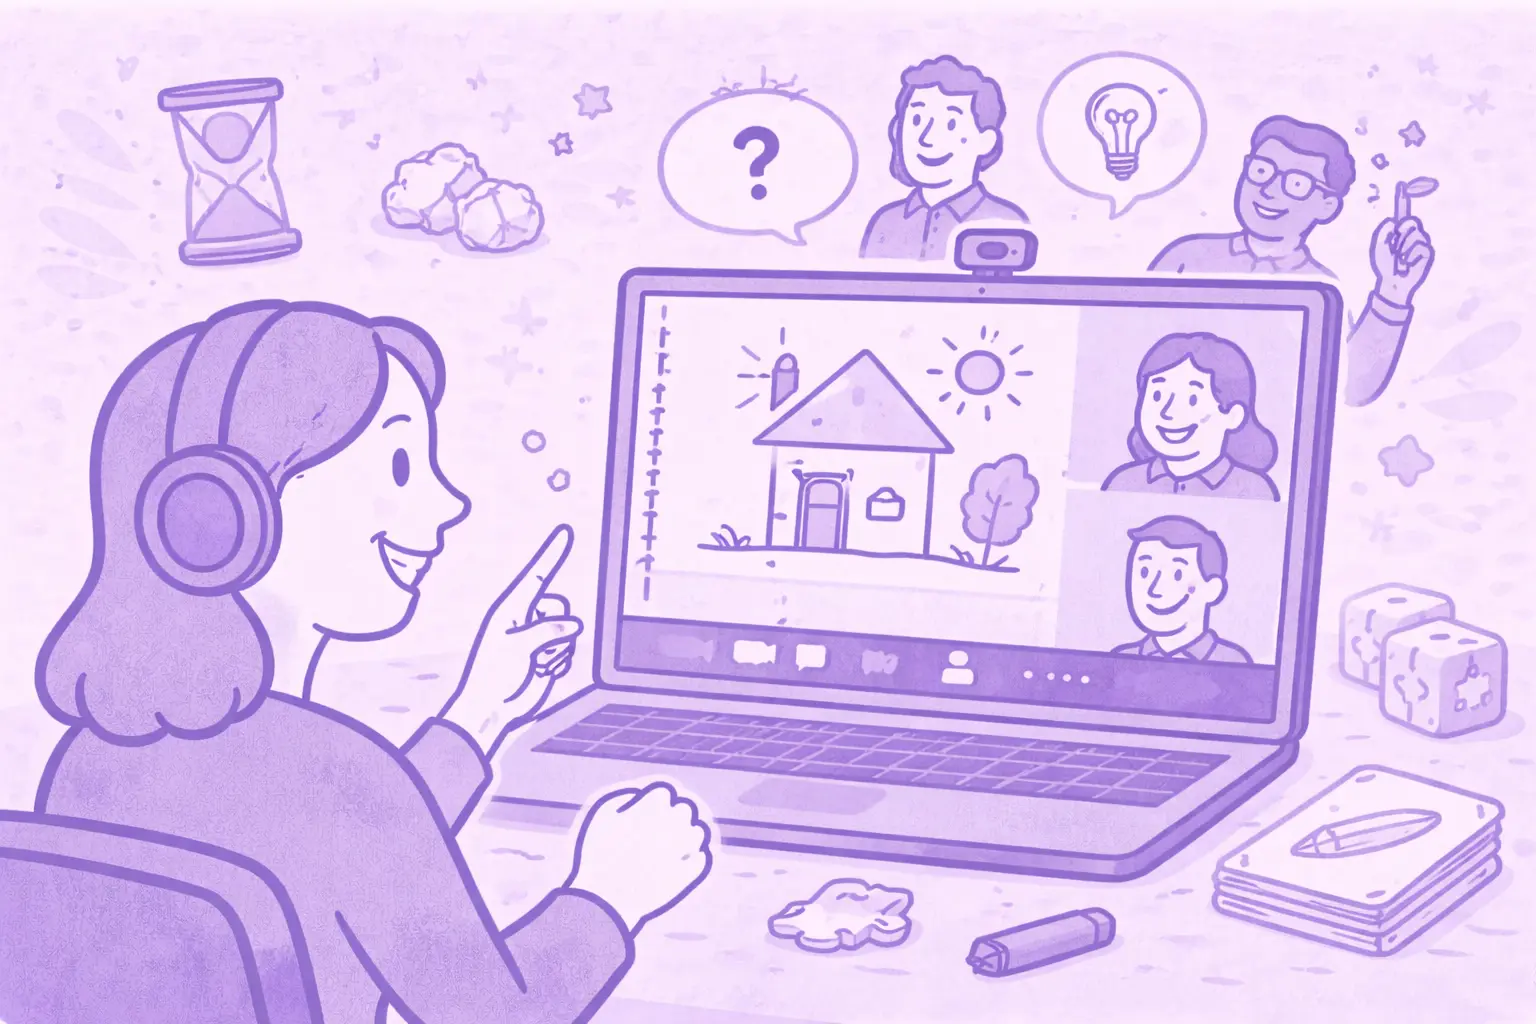
Visualization makes conveying complex data more understandable. Let's discover how to level up your next meeting with visual assets.


Juggling information has become tougher than ever. The complexity, dimensions, and different sources make it almost impossible to convey the message in a way that’s 100% clear and understandable for the viewer.
That’s why data visualization is crucial, especially in the business world. Basically, this is a graphical representation of relevant data and information with the help of charts, maps, graphs, and other visuals.
There are two primary groups – static and interactive data. While static data is usually pre-designed and fixed, interactive data allows the viewer to explore the details and manipulate the visualization.
This way of displaying information makes conveying complex data more understandable. Regardless of the presentation or nature of the meeting– effectiveness, particularly in the context of data migration tools, is the key.
To learn how to incorporate visual data and level up your meetings, read on!
Right off the bat, let’s get into the benefits of data visualization in business meetings.
There’s no denying the fact that – with constant advancements in technology – everything has become more accessible. Any bit of information is one click away or a QR code scan apart.
Visualization of complex data makes it a lot easier for people to understand what’s being conveyed and have full access to the information. Also, let’s not forget that these visual representations not only simplify but also tear down language barriers for individuals with varying levels of data literacy.
Sorting through an enormous pile of information and picking up the essence of it is much more difficult when you have a million numbers in front of you.
That's why, with data visualization, the viewer can pick up the significance, understand the relationship between the numbers, and understand the trends that depict the results.
Whether it's through a color-coded table in Excel, PowerPoint presentation, or a 3D graph, the understanding of information presented with the help of visuals is almost incomparable with the traditional scribbling and sorting through 40 pages of paper.
To enhance your data visualization strategies, grounding in crucial skills like data engineering is essential. Understanding how to efficiently ingest and manage data can significantly improve your insights presentation. Consider exploring data engineering with DataCamp to develop these competencies, enriching your team's ability to communicate effectively during meetings.
Data visualization can also help a lot when it comes to problem-solving in the workplace. By depicting information and data with the help of different visuals, employees, and employers can better discern the essence and thus make well-calculated decisions.
Needless to say – this way of conveying and presenting information will have a positive effect on further business. Once you see the results, you won’t rely on any other communication strategy.
Last but certainly not least – there is the undeniable advantage of time.
Imagine going through piles of paper filled with both relevant and irrelevant data and going through a PowerPoint presentation or just looking at a graph that shows only the data that’s crucial to your meeting.
Instead of spending 90 minutes sitting in a meeting trying to grasp the essence and not succeeding, data visualization allows you to single out the relevant information and present it in a way that’s more understandable and time-efficient.

As hinted in the introduction, there are two major groups within data visualization: static and interactive data.
Let’s dive into their essence, differences, and in which situations they should be used.
As you could’ve guessed – static data are fixed. The goal behind static data visualization is to provide the viewer with a concise snapshot of information at one point in time. Some key characteristics include simplicity, fixed presentations, snapshots, and publications.
When it comes to situational usage, static data is best suited for situations where there is no change. For example, you should include static data visualization in monthly or yearly reports for your business, where the point is to strictly to convey information that sums up one period of time.
Contrary to static, we have interactive data visualization, and it’s the complete opposite – this type of data visualization allows the viewer to respond. This contributes to further exploration and interaction during the meeting. Key characteristics of this type of data visualization are user engagement, dynamics, and customization.
As with the previous one, interactive data visualization is best suited for meetings where the audience needs to further explore, analyze, and make decisions based on the already presented data.
Bonus tip: The combination of static and interactive data visualization can contribute to a successful data communication strategy in the workplace.

It’s time to touch on a delicate topic that can make or break your presentation – the design principles for effective data visualization. You need to bear in mind these three crucial factors before you present the data in a meeting.
First, you need to make sure that it’s suitable for your target audience. What does this mean? Well, you need to know their familiarity with the data you’re presenting.
There’s also the undeniable factor of clarity. Regardless of the complexity of the topic, you need to make sure that the data you’re presenting are clear and simple. After all, the essence of data visualization is for the viewer to understand it more easily.
As a presenter, you need to be consistent in your designs – don’t jump from one format to the other. Within this section, power bi training contributes to template standardization, uniform use of fonts, and even annotation rules – all vital factors. However, just note that you can also use customizable online templates from sites like Picsart to showcase your data in a visual way. Graphics programs are especially helpful if you want to add some uniqueness to your presentations.
We can’t go on before mentioning colors in data visualization. Although this might seem like a secondary issue, that couldn’t be more far from the truth. On a psychological level, the choice of colors in presenting data can determine how well the viewer has acquired and understood the issue. For example, the color yellow in your presentation signals caution, while blue stands as a testament to trust.

As with any other business endeavor, mistakes are bound to occur at some point. Learning how to address common mistakes in data visualization brings you one step closer to crafting an impeccable presentation that’s time-efficient and easy to understand.
So, let’s go through the most common errors:
1. Although they are your trusted allies when it comes to giving a presentation at a meeting, overusing visuals and overcrowding information will lead you right back to where you started – making it harder for the viewer to decipher what’s relevant and what’s not.
2. Also, when opting for data visualization, you need to use the appropriate charts – not all visuals can represent the essence of the data that you’re aiming for. For instance, Jira charts, as bar charts, are an excellent choice for comparisons.
3. There’s also the issue of context – you could easily be missing some crucial background information. Although AI advancements serve as a common and useful shortcut for gathering information in the nick of time, you must not forget to add background information where you think it’s needed – for example, as annotations.
It’s final – relying on data visualization is your key to carrying out meetings successfully, understanding information, and creating an impeccable presentation for your colleagues. Whether it’s through static or interactive data – this way of conveying the essence has transformed how meetings are held and how employees soak in the information.
When opting for data visualization, you need to make it suitable for the target audience, consider crucial design principles, and choose the right colors, of course.
On a similar note, make sure to avoid overcrowding information, choosing inappropriate charts, and forgetting to add necessary background information.
So, with all this in mind, if your goal is to take your business meetings to another level and make them more visually pleasing and efficient – your next order of business would be to check out MeetGeek — where meetings are rewarding experiences.
Best AI Note Taker for Google Meet in 2026
How each tool captures a Meet call, whether Gemini already covers you, and what your Workspace tier and admin actually allow.
Is There a Microsoft Teams Time Limit?
Wondering if Microsoft Teams has a time limit? Compare free vs. paid plans, meeting duration, participant limits, recordings, and more.

Best AI Note Taker for Zoom: 8 Tools Tested (2026)
How 8 AI note takers actually connect to Zoom, and what each one does when you are not the meeting host.
7 Best Free AI Meeting Note Takers in 2026 (Tested)
A hands-on look at seven free plans, including how many meeting hours you actually get before the paywall starts.
How to Schedule a Meeting in Google Meet: 2026 Step-by-Step Guide
Three desktop methods, two mobile flows, and one trick to make every scheduled call more productive.

Funny Zoom Backgrounds for Every Kind of Meeting
Discover the best funny Zoom backgrounds for work calls and virtual meetings, including memes, TV scenes, fake offices, and AI-generated ideas.
The Agile Retrospective Meeting Template: 5 Formats That Work
Five retro formats (Start/Stop/Continue, 4Ls, Mad/Sad/Glad, Sailboat, DAKI), when to use each, and the commitment step that turns talk into change.
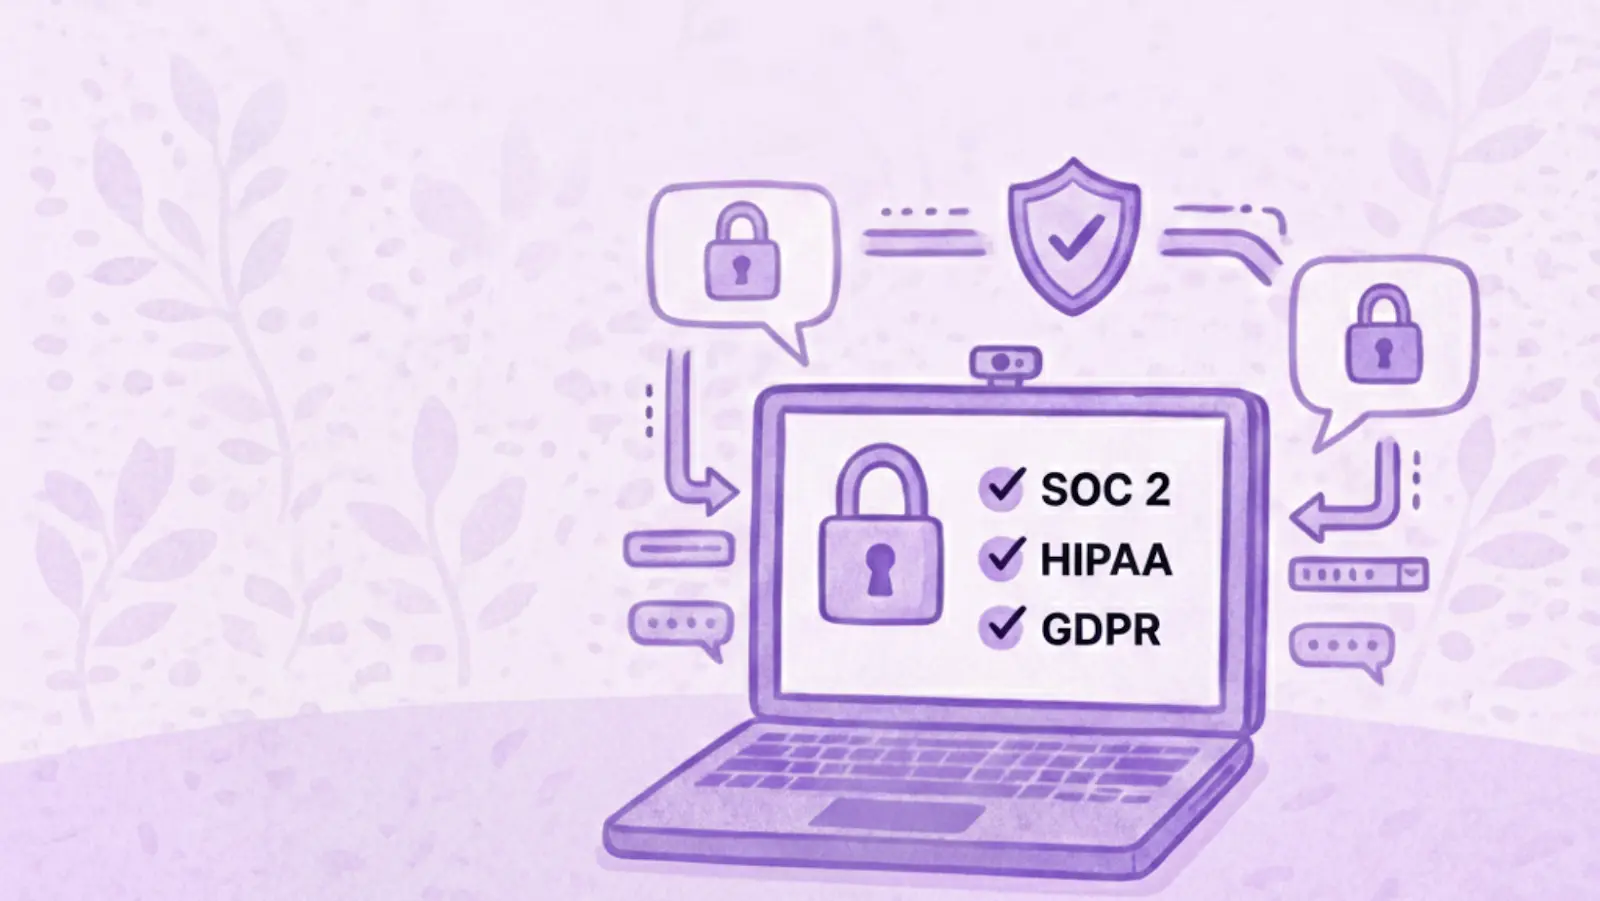
HIPAA-Compliant Meeting Transcription Tools: A Vetting Guide
What HIPAA actually requires of transcription tools, why most AI notetakers don't qualify, and a 10-item checklist for clinical operations teams.

Zoom Test Meeting: Step-by-Step Guide to Test Your Setup Before Any Call
Learn how to run a Zoom test meeting, fix mic and camera issues, and ensure your setup is ready before any important call.
The Project Kickoff Meeting Playbook (+ Template)
A 7-part project kickoff meeting agenda, copy-paste template, and 24-hour follow-up checklist. Everything you need to align scope, roles, and timelines in 60 minutes.

What Is an Annual General Meeting (AGM)? A Complete Guide
Understand annual general meetings, what to include in an AGM agenda, and how to run structured, compliant meetings that drive decisions.
Is It Illegal to Record Someone Without Their Permission?
Recording a conversation can be legal in some situations and illegal in others. This guide explains when recording someone without permission is allowed in the U.S. and EU, how consent laws work, and how to avoid legal trouble.
Games to Play On Zoom: 20 Ideas for Team Building (And Actual Laughs)
A practical list of Zoom games that help remote teams connect, boost energy, and make virtual meetings more engaging and interactive.
How to Automate Meetings Securely in Regulated and High-Risk Environments
Learn how to automate meetings in regulated environments without compromising security, privacy, or compliance.
Top tl;dv Alternatives to Streamline Your Meetings
Discover the top tl;dv alternatives and explore and compare their features to choose the right AI meeting tool for your organization.
AI Meeting Agents: How Autonomous AI Is Transforming the Future of Work
Discover how AI meeting agents are redefining the future of work—handling scheduling, follow-ups, and even speaking on your behalf to save time and turn every meeting into real action.
Granola AI Alternatives: The 5 Best Note Takers in 2026
Prices, plan limits and language counts checked against each vendor's own pricing page and our comparison data in July 2026.
Follow-Up Email After Interview: How to Write It, When to Send It, and What to Say
Discover how to write an effective follow-up email after an interview. From timing and templates to tone and structure, this guide covers everything you need to stand out and stay memorable.
Tactiq Pricing 2026: Is It Worth It? Plans & Costs
A clear look at every Tactiq plan, what AI credits really limit, and how the costs add up for solo users and teams.

Ad Hoc Meeting Meaning and How to Run One
Discover the true ad hoc meeting meaning and learn how to make spontaneous discussions more focused and effective. Find out when to hold and manage them.

Virtual Meeting Etiquette: 15 Essential Rules for Professional Video Calls
Discover 15 essential virtual meeting etiquette rules and tips that keep conversations focused, professional, and engaging.
How to See Your Google Meet History and Find Recordings (4 Easy Methods)
This article explores various ways to see your Google Meet history, recover and share recordings, and outlines the requirements for accessing this data.
Fireflies AI Pricing | Review & Things I Wish I Knew Before Buying (2026)
Explore Fireflies 2026 pricing and features. Learn why users switch from this platform and choose alternatives for AI meeting summaries and insights.
How to Choose the Right Meeting Minutes Templates for Different Types of Meetings
Understanding the different meeting types and their documentation needs is the first step in choosing the right template. In this article, we will learn how to do that.
How to Access and Review Your Zoom Meeting History: A Complete Guide
In this article, we’ll walk you through how to access and review your Zoom meeting history: both using Zoom’s built-in tools and with the help of an AI meeting assistant.
Best AI Note Takers for In-Person Meetings in 2026
We tested mobile apps, bot-free notepads, and hardware recorders to find what actually captures a conversation in the room.

How to Record Discord Calls: 5 Methods (2026)
Five ways to capture a Discord voice or video call on Windows, Mac, iPhone, and Android, plus how to get an automatic transcript.
How to Use Zoom Chrome Extension & 9 Best Extensions for Meetings
This guide will show you exactly how to use the Zoom Chrome extension and some other tools to simplify your meeting process.

How to Record a Webex Meeting: Step-By-Step for Desktop, Mobile, and Cloud
Record on Webex by using the built-in recording feature or enhance recording with third-party tools like the MeetGeek AI Chrome extension.

Meeting Overload Isn’t the Real Problem - Bad Meeting Design Is
When meeting overload becomes obvious, there are soma small changes that can transform your entire meeting culture.

How to Record Video Conferences: A Guide to Built-in Features and AI Tools
Record video conferences using built-in platform tools or AI transcription services to create lasting assets. Use tools like MeetGeek to automate collaboration and improve productivity.

AI Meeting Notes: Your Guide to Automated Meeting Documentation in 2026
Let's take a closer look at everything you need to know about free AI meeting notes options.
4 Best Free Transcription Software For 2026 | Personally Tested
In this article, we share the 4 best transcription software we found based on personal testing for 2026.

Read AI Review: Why are so many people leaving it? (2026)
We will guide you through the key features, pricing, pros and cons, and give some insights into why users are switching from this AI meeting assistant.
Otter AI Pricing: 4 Things To Know Before Buying (2026)
"Is Otter AI worth it?" It is a good question, and many of you asked. Learn what we found about Otter AI's pricing and features and what other options you have.
Gong Pricing In 2026 | This will save you +$30,000
If you considered Gong, you probably asked the question, "How much does Gong cost?". Discover how much Gong customers pay and what other options you have.
How to Join Zoom with Meeting ID + Alternatives
Discover how to join a Zoom meeting using a Meeting ID and explore alternative methods to connect seamlessly.

6 Best Meeting Notes Apps in 2026 (Tested & Ranked)
We not only collected the top AI meeting assistants in this article but also the best apps for manual note-taking when it comes to meeting notes.

We Tested And Found The 5 Best Fathom Alternatives for 2026
After a deep dive into users' experience with this AI meeting assistant, we found what the best Fathom alternatives are for you.
6 Best Gong Alternatives After +2 Years Testing (2026)
We invested over 300 hours in this project to discover the best Gong alternatives. Let's delve into the best ones.

When & How to Organize an In-Person Meeting in 2026
Plan smarter in-person meetings! Learn when to meet, how to organize effectively, and make every gathering productive and engaging.
.png)
Best 7 AI Note-Takers In 2026 | 15+ Tested Tools
I tried +15 AI note-takers to find the best ones. This article reveals the best AI note-taker based on features and pricing.
How to Have an Effective Touchpoint Meeting: Strategies for Managers
Want to conduct successful touchpoint meetings? Learn actionable tips and strategies to foster collaboration, track progress, and inspire your team to achieve more.

How to Plan and Run Productive Sales Meetings [+Free Sales Meeting Agenda]
Learn effective strategies to make your sales meetings more impactful and productive. Discover tips to boost engagement and results!

How to Run an Effective Discovery Meeting
Learn how to run an effective discovery meeting with practical tips and strategies that ensure success.

How to Master Scrum Meetings: Best Practices & Templates
Learn how to run effective Scrum meetings with practical tips and templates. Streamline your workflow, boost team collaboration, and get the most out of every meeting!
Google Meet vs. Zoom: Which One to Choose in 2026
Discover the ultimate showdown between Google Meet and Zoom in 2026! Find out which video conferencing tool wins in features and value.

20 Outside-the-Box Ideas for Team Meetings
Energize and engage your team with one of these 20 innovative team meeting ideas.

How to ‘Share Screen’ on Zoom [PC/Mobile] + Pro Tips
Learn how to share your screen during Zoom meetings on both PC and mobile devices with our expert tips!

The 10 Secrets to Effective Meeting Management
Unlock the secrets to effective meeting management! Discover 10 game-changing strategies for productive meetings.
How to Set Up a Zoom Meeting & Stellar Tips for Boosted Engagement
Master the Zoom setup with our easy step-by-step guide. From scheduling to hosting, learn how to connect & engage in the digital world.
How to Set Up a Teams Meeting: A Step-by-Step Guide for Beginners
Learn to set up a Teams meeting effortlessly with our beginner-friendly guide. From scheduling to inviting, we cover every step!

How to Have a Successful Business Meeting in 2026
Master the art of successful business meetings this year with our top tips for planning, engaging, and achieving results in the modern workplace.

How to Join a Zoom Meeting from Any Device in 2026
Step into 2026 with ease: Learn to join Zoom meetings from any device with this simple, user-friendly guide for seamless virtual connections.

How to Change the Zoom Host + How to Add a Zoom Alternative Host
Learn the quick and easy steps to change hosts in Zoom meetings with this comprehensive and beginner-friendly guide.

How to Choose the Right Meeting Cadence: The Manager’s Playbook
Unlock the secrets to setting the perfect meeting cadence for optimal team productivity with this guide for managers.

What is Virtual Meeting & What to Expect in 2026: A Look Ahead
Discover the future of virtual meetings in 2026 and some out-of-time tips with this insightful article.

How to Transcribe Zoom Meetings into Google Docs without Additional Permissions
Learn how to efficiently transcribe your Zoom meetings into Google Docs with these simple steps. Increase productivity and easily reference past discussions.

The Ultimate End-of-Year Review: A Guide for Managers
Master the art of end-of-year reviews with our comprehensive guide for managers. Learn proven strategies to evaluate performance and set goals for success in the coming year.

How to Run an Effective Brainstorming Session
Get ready to unlock your team's creativity. Don't miss this guide to running an effective brainstorming session that will bring innovative ideas to life.

How to Host the Ultimate One-on-One Meeting
Discover how to organize one-on-one meetings that improve communication, foster engagement, and build stronger relationships in your team by reading this article!
Effective Data Visualization for Meeting Insights
Visualization makes conveying complex data more understandable. Let's discover how to level up your next meeting with visual assets.

How to Facilitate Inclusive and Collaborative Meetings
Good meeting planning and facilitation are what makes team meetings inclusive, collaborative, and effective leading to problem resolution and new idea generation.

Innovative Meeting Formats: Exploring Alternatives to Traditional Business Meetings for Enhanced Creativity
Explore some alternative meeting formats that can revolutionize how your team collaborates and generates ideas.

Top 8 Online Virtual Meeting Platforms for Growing Organizations
With more and more virtual meeting platforms being available in the market, choosing the right one for your business can be quite confusing and challenging.

How to Record Google Meet on Any Device in 2026
Discover how to easily record a Google Meet in our comprehensive guide. Read this article to never worry about missing important information again!

The Power of a Blog: How Meetings Can Be Transformed into Engaging Content
In this article, we'll unpack six inventive strategies for leveraging meeting transcripts to enhance your marketing efforts.

The 10 Best Vowel.ai Alternatives for Your Meetings
Click through for a look at 7 of the top alternatives to Vowel for your next meeting.

The 10 Best Meeting Scheduling Software for 2026
The best meeting scheduling tools offer a frictionless experience for all participants. Here are 10 options that will save hours of your time!

10 Ways an AI Meeting Assistant Can Help With Your Meetings & Interviews
Without the right tools in place, meetings can be a painful process. Read this article to explore the 10 best use cases of having an AI meeting assistant!

Find Your Perfect Meeting Notes Template
Are meetings a part of your work life, but you have no idea what they should contain or even look like? Read this article to get your meeting notes template!

How To Record a Zoom Meeting If You’re Not a Host
Discover how to record Zoom meetings without hosting privileges from any device for a streamlined meeting experience!

15 Free Meeting Agenda Examples
Are you still trying to find the perfect meeting agenda examples to use as inspiration before your next meeting? Check out our free 15 templates!

Why You Need to Set Meeting Goals and How to Do That
The first step to a successful meeting is defining your meeting goals. Read this article to learn how high-performing teams do this!

6 Tips to Write a Successful Meeting Agenda with Examples
Want to write the ultimate meeting agenda and achieve all-time productivity in your team meetings? Follow these 6 pro tips to learn how and check out our free templates to get started.

The 5 Best Types of Check-In Questions for Meetings
Are you a manager trying to find the best check-in questions for meetings? Read this before your next meeting!

How to Write an Effective Meeting Invitation Email
Ever wondered what the recipe for a successful meeting invitation email is? Read this article to learn all of our tips and insights!
How to Write an Effective Meeting Recap: Tips & Templates
Discover 10 practical tips to write clear and effective meeting recaps that keep your team informed and on track. Enhance communication and productivity with these easy steps.

15 Types Of Meetings: What Makes Them Different & Tips
Are you a manager who wants to master the art of hosting meetings? Learn how to approach these 15 types of meetings effectively with our exclusive tips!

10 Types of HR Screening Questions to Ask If You're a Hiring Manager
Are you trying to find the best candidate for a job posting in your company? Read this article to discover the best types of HR screening questions!
Two-minute setup. Free forever foundation. Enterprise-grade from day one. Turn meetings into a positive and rewarding experience