30+ Sales KPIs to Track in 2026
Unlock the secrets to sales success in 2026 with this guide to over 30 essential sales KPIs. Learn what to track to drive your team’s performance and revenue growth.

✅ Free meeting recording & transcription
💬 Automated sharing of insights to other tools.

Source: Freepik
Tracking the right sales KPIs is the key to meeting and exceeding your sales targets this year. But with so many metrics to choose from, it’s hard to determine which numbers actually help you drive performance.
In this guide, we’ll simplify it for you. Whether you’re a sales manager, a business owner, or part of a sales team, we break down over 30 essential KPIs that can help you improve efficiency, focus on what matters, and hit your goals.
What Are Sales KPIs?
Sales KPIs (Key Performance Indicators) are measurable values that help you track and document the effectiveness of your sales efforts. They provide insight into how well your sales team is performing and whether you're on track to meet your sales goals.
Sales Metrics vs. Sales KPIs
It’s easy to confuse sales metrics with sales KPIs, but they are not the same thing. Sales metrics track general activities like how many calls or emails your team sends or how many deals they close. While useful, they don’t always show if you’re meeting your big-picture goals.
Sales KPIs, on the other hand, are specific metrics that directly tie to your goals. They focus on the key numbers that show your progress. For example, “Revenue from New Customers” is a KPI that helps you track growth in your customer base.
In short, all KPIs are metrics, but not all metrics are KPIs. KPIs give you actionable insights, while metrics mostly track daily activities.
Why Do You Need to Track Sales KPIs?
Tracking sales KPIs is essential because it helps you understand how well your sales team is performing and whether you’re moving toward your business goals. Here’s why it’s so important:
- Measure progress toward goals: Sales KPIs give you clear data to see if you’re on track to hit your targets. Whether it’s monthly revenue, customer acquisition, or deal closing rates, KPIs show where you stand and highlight areas that need improvement.
- Identify strengths and weaknesses: By tracking KPIs, you can pinpoint what’s working and what’s not. For example, if your lead conversion rate is low, it might mean you need to focus on better qualifying leads or improving your sales pitch.
- Improve decision-making: Instead of shooting in the dark, you can use factual data to adjust your strategy, reallocate resources, or coach your team more effectively.
- Motivate your sales team: Sharing KPIs with your team keeps everyone focused on the same goals and increases sales rep productivity. It’s a great way to motivate sales reps by showing them how their efforts contribute to the bigger picture.
- Stay competitive: Tracking KPIs keeps you on top of market trends and your performance relative to competitors. This way, you can adapt quickly and make changes as needed.
How to Choose the Right KPIs
To decide the best KPIs for your business objectives, isolate your primary goal from any secondary ones.
Example: If your goal is to increase revenue, focus on KPIs like total sales, revenue growth, or average deal size. If you’re prioritizing efficiency, track metrics like sales cycle length or lead response time. The right KPIs should directly support your business objectives.
Additionally, every business has a unique sales process, and your sales key performance indicators should reflect that.
Example: If you have a long sales cycle, track touchpoints per lead or time-to-close. If your sales are high-volume and fast-moving, KPIs like conversion rates or calls-to-close ratio may be more relevant.
When choosing KPIs, select those that measure performance at key stages of your sales funnel. Good KPIs aren’t just numbers; they should help you make decisions.
Example: Tracking lead conversion rates can show whether your team needs better training or more qualified leads. Avoid KPIs that don’t provide clear insights or lead to meaningful action.
And remember, different KPIs may be relevant at different levels, which is why you must take team and individual goals into account.
Example: A sales manager might track team-wide KPIs like total revenue or pipeline value. An individual sales rep, on the other hand, might focus on personal KPIs like call volume, meeting bookings, or deal closures.
NOTE: Tracking too many KPIs can be overwhelming, so focus on just a few that align with your priorities. This makes it easier to stay clear and take action. If a KPI no longer fits your goals, update it to keep things relevant and on track.

Best 30+ Sales KPIs to Track this Year
Here are 30 sales KPIs you need to track:
- Sales Revenue
- Sales Growth Rate
- Sales Volume by Location
- Close Ratio
- Average Sales Cycle Length
- New Leads
- Existing Client Engagement
- Upsell and Cross-Sell Rates
- Deals Closed
- Customer Acquisition Cost
- Opportunities Created
- Proposals Sent
- Customer Churn Rate
- Customer Satisfaction Score
- Customer Outcomes
- Expansion Revenue
- Reference-Based Clients
- Monthly Sales Growth
- Monthly Recurring Revenue (MRR)
- SQL-to-Customer Conversion Rate
- Average Profit Margin
- Deal Win-Loss Ratio
- Percentage of Leads Followed Up With
- Meeting Acceptance Rates
- Positive vs. Negative Reply Rates
- Average Response Time
- Customer Lifetime Value (CLV)
- MQL-to-Customer Conversion Rate
- Customer Retention Rate
- Net Promoter Score (NPS)
- Cost Per Acquisition
- Average Revenue Per Account
- Cost Per Lead
- Average Length of Customer Lifecycle
KPIs for Sales Managers
1. Sales Revenue
‘Sales revenue’ is the total amount of money your team brings in from sales during a specific timeframe. It shows how well your team is doing, whether they’re hitting their targets, and how much they’re contributing to the company’s overall growth.
For example, if your monthly sales revenue goal is $100,000, and you’re at $80,000 by mid-month, you’ll know to focus your efforts on closing deals before the month ends.
2. Sales Growth Rate
‘Sales growth rate’ measures the increase (or decrease) in revenue over time. It helps you see whether your sales strategies are effective and if your business is expanding. To calculate it, compare sales from one period (like a month or quarter) to the previous one.
For instance, if your team generated $50,000 last month and $55,000 this month, your growth rate is 10%. A consistent growth rate is a sign of a healthy sales process.
3. Sales Volume by Location
‘Sales volume’ shows how much your team sells in different regions or markets. This is useful if your business operates in multiple locations.
For example, if sales in one region are consistently lower, you might need to adjust your marketing strategy or focus more resources there. Conversely, if a specific location is outperforming others, it could serve as a model for your other sales regions.
4. Close Ratio
The ‘close ratio’, aka ‘win rate’, measures how many leads your team successfully converts into customers. It’s calculated by dividing the number of deals closed by the total number of leads.
For example, if your team closed 25 out of 100 leads last month, your close ratio is 25%. A low close ratio shows you need to focus on better lead qualification or improved sales training.
5. Average Sales Cycle Length
‘Average sales cycle length’ tracks the average amount of time it takes to close a deal from the initial contact with a lead. Knowing this helps you identify bottlenecks in your sales process.
Let’s say your usual cycle is 30 days but deals are now taking 45. This could mean your team needs to follow up more quickly or address objections sooner.
6. New Leads
‘New leads’ track potential customers who have entered your sales pipeline. Tracking this KPI helps you understand how well your lead-generation efforts are working.
For example, if your goal is 50 new leads per week, but your team is generating only 30, you should adjust your marketing campaigns or outreach strategy.
7. Existing Client Engagement
‘Existing client engagement’ underscores how successful you are at maintaining relationships with current customers. It can include metrics like repeat purchases, email open rates, or participation in loyalty programs, all of which can impact your long-term success.
For instance, if engagement drops among long-term clients, it might indicate a need for more personalized communication or better customer support.
As a sales manager, you should consistently evaluate and improve your team’s approach and communication style. If you want deeper insights into your effectiveness, MeetGeek can help.

MeetGeek records and analyzes your sales calls, providing actionable insights such as:
- Agenda follow-through: MeetGeek compares the planned agenda with what was actually discussed during the call, helping you see if topics like product demos or pricing were properly addressed.
- Main themes: Access a summary of the main topics discussed during each call to understand what resonated most with prospects.
- Speaker distribution: Get a clear view of participation by speaker, so you can see how much time your reps spend talking versus listening to prospects.
- Quick improvement tips: MeetGeek identifies the top two areas where sales reps can improve and highlights what they did best, making it easy to provide targeted coaching for future calls.
The best part? You can also customize these insights to align with your sales goals, so your insights are tailored to what matters most for your team’s success.
8. Upsell and Cross-Sell Rates
Upsell and cross-sale rates track how often your team successfully sells additional products (upselling) or complementary products (cross-selling) to existing customers.
For example, if a customer buys a laptop and your team also sells them a warranty or accessories, that’s a cross-sell. Knowing how frequently these occur helps you maximize revenue from current clients.
KPIs for Business Development
9. Deals Closed
‘Deals closed’ is the number of agreements or contracts successfully finalized within a specific period. It’s a direct indicator of how effectively your business development team is converting leads into customers.
For example, if your team closed 20 deals last month compared to 15 the month before, your strategies are working. If the number drops, you must reassess your approach to negotiations or lead qualification.
10. Customer Acquisition Cost
‘Average Customer acquisition cost’ measures how much your company spends to acquire a single new customer. This includes marketing, sales, and any other associated costs. To calculate it, divide your total acquisition expenses by the number of new customers gained during the same period.
For example, if you spent $10,000 on marketing and sales and gained 100 new customers, your CAC is $100. Keeping CAC low while maintaining high-quality leads ensures long-term profitability. If CAC is rising, it could mean your team needs to optimize marketing campaigns or improve lead conversion efficiency.
11. Opportunities Created
‘Opportunities created’ tracks the number of potential sales opportunities your team generates. This could be new leads moving into the pipeline or existing customers expressing interest in additional services.
For example, if your team created 50 new opportunities last month, that’s 50 potential deals in progress. This helps you measure how well your team is filling the pipeline, so you have a steady flow of potential business. If opportunities are low, you may need to focus your outreach efforts or improve lead generation strategies.
12. Proposals Sent
‘Proposals sent’ is the number of formal offers your team sends to prospects or existing clients. This KPI gives insight into how actively your team is pursuing potential deals.
If your team sends out 30 proposals in a month but only closes five deals, you need to refine the quality of your proposals or target more qualified prospects.
KPIs for Account Managers
13. Customer Churn Rate
‘Customer churn rate’ measures the percentage of customers who stop using your product or service over a specific period. To calculate the churn rate, divide the number of customers lost during a period by the total number of customers at the start of that period.
If you had 200 customers at the start of the month and lost 10, your churn rate is 5%. A high churn rate might mean your customers aren’t satisfied or getting enough value, so you might need to improve communication, support, or engagement strategies.
PRO TIP: To improve your client communication, check out our guide on creating the perfect talk track for your team!
14. Customer Satisfaction Score
The ‘customer satisfaction score’ measures how happy customers are with your product, service, or support. You can collect this data through surveys where customers rate their satisfaction on a scale (e.g., 1 to 5 or 1 to 10).
After resolving a support ticket, for instance, you could ask, “How satisfied were you with our service?” and track responses to calculate the average score. A low CSAT score might indicate issues like poor communication or unmet expectations, giving you a clear starting point for improvement.
15. Customer Outcomes
‘Customer outcomes’ track the tangible results or successes your customers achieve by using your product or service. This KPI is more relevant if you work in industries like software, where the value of the service is tied to the client’s success.
For example, if a customer uses your software to increase their team’s efficiency by 20%, that’s a measurable outcome that helps you demonstrate value to customers. When outcomes are positive, they also provide great material for case studies or testimonials.
16. Expansion Revenue
‘Expansion revenue’ refers to the increase in business generated from existing customers, such as through upselling, cross-selling, or higher usage of your product.
If a customer expands their subscription plan or purchases additional services, it’s a sign of organic growth. Monitor this KPI to identify opportunities to offer more value to your clients and reinforce customer loyalty.
17. Reference-Based Clients
‘Reference-based clients’ measures how many new clients are referred by your existing customers. If your customers are willing to recommend your services, it means they see value in what you offer.
For example, if a satisfied client refers three new businesses to you, that’s a direct result of strong account management. To supercharge your efforts, implement special programs, and maintain a high standard of service that motivates customers to spread the word.
18. Monthly Sales Growth
‘Monthly sales growth’ tracks the month-over-month increase in sales within your accounts. For account managers, this can involve upselling or cross-selling to existing clients.
For example, if sales from managed accounts grew from $50,000 to $55,000 in one month, that’s a 10% growth. This helps you retain your accounts, contributing to the company’s revenue growth.
19. Monthly Recurring Revenue (MRR)
‘Monthly Recurring Revenue’ (MRR) is the predictable revenue your company earns from customers every month, which is particularly relevant for subscription-based businesses.
For example, if a client subscribes to a service at $1,000 per month, that amount contributes to your MRR. Tracking this ensures you’re maintaining consistent revenue and highlights opportunities to grow through renewals or service upgrades.
KPIs for Sales Development
20. SQL-to-Customer Conversion Rate
The ‘SQL-to-Customer conversion rate’ measures how many Sales Qualified Leads (SQLs) turn into actual customers. Tracking this KPI helps you understand the effectiveness of your sales team in moving qualified leads through the funnel.
For example, if you have 50 SQLs in a month and 10 of them become customers, your conversion rate is 20%. A low conversion uncovers issues in your sales process, like the need for better follow-up or stronger closing techniques.
21. Average Profit Margin
'Average profit margin' measures the profitability of your sales efforts. It’s calculated by subtracting costs from revenue and dividing the result by revenue. For example, if a sale generates $1,000 in revenue and costs $700 to deliver, your profit margin is 30%.
Once you know your profit margin, it’s important to understand what it tells you. A profit margin of 10% or higher usually means your business is running efficiently and converting revenue into profit effectively. This is a strong indicator of financial health.
However, if your profit margin is below 5%, it might signal an issue. It could mean your costs are too high, your pricing is too low, or there are inefficiencies in your processes. In that case, you’ll need to take a closer look at what’s causing the low margin and figure out how to improve it.
22. Deal Win-Loss Ratio
‘Deal Win-Loss Ratio’ compares the number of deals won to the number of deals lost. It shows how successful your team is at closing opportunities. To calculate it, divide the number of deals won by the total number of deals (won + lost).
For example, if your team won 15 deals and lost 10, the win-loss ratio is 60:40. Monitoring this metric helps you identify patterns in lost deals and take steps to improve, such as refining your pitch or addressing objections more effectively.
23. Percentage of Leads Followed Up With
‘Percentage of Leads Followed Up With’ measures how consistently your team follows up with the leads they generate. You can calculate it by dividing the number of leads followed up with by the total number of leads received.
For example, if your team followed up with 80 out of 100 leads in a week, the follow-up rate is 80%. A low follow-up rate could mean missed opportunities, so get your team to stay proactive and engaged with potential customers.
24. Meeting Acceptance Rates
‘Meeting acceptance rates’ measure the percentage of meeting invitations sent that are accepted by prospects. They tell you how effective your outreach is and whether prospects find value in speaking with your team.
For instance, if your team sends out 50 meeting invites and 25 are accepted, the acceptance rate is 50%. Low rates indicate that your messaging isn’t compelling enough or that you’re targeting the wrong audience, signaling a need for adjustments.
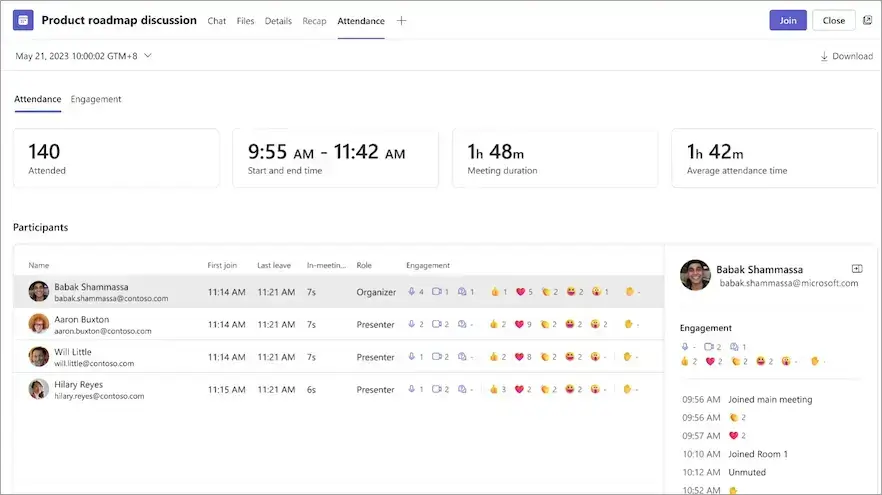
To effectively manage your team’s sales meetings without attending every call, you must find a way to properly document the entire process. Here’s where MeetGeek comes in.
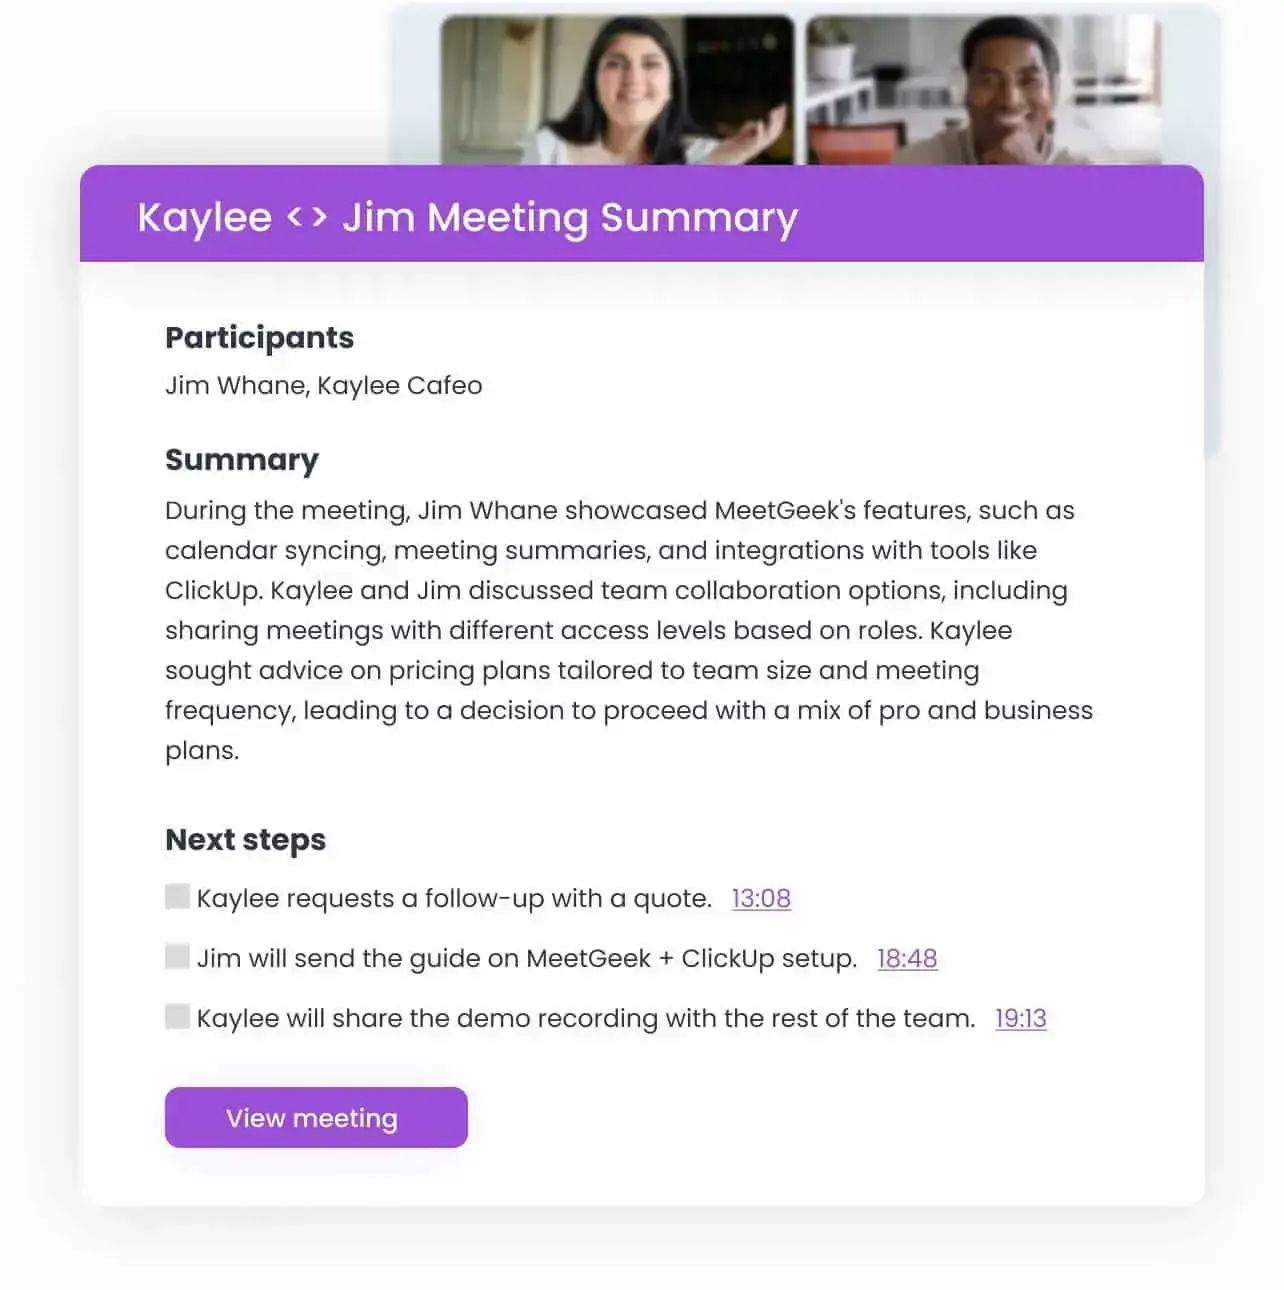
This AI Meeting Assistant for sales teams records, transcribes, summarizes, and follows up on every sales meeting, making it easier for managers and teams to stay aligned and improve performance.
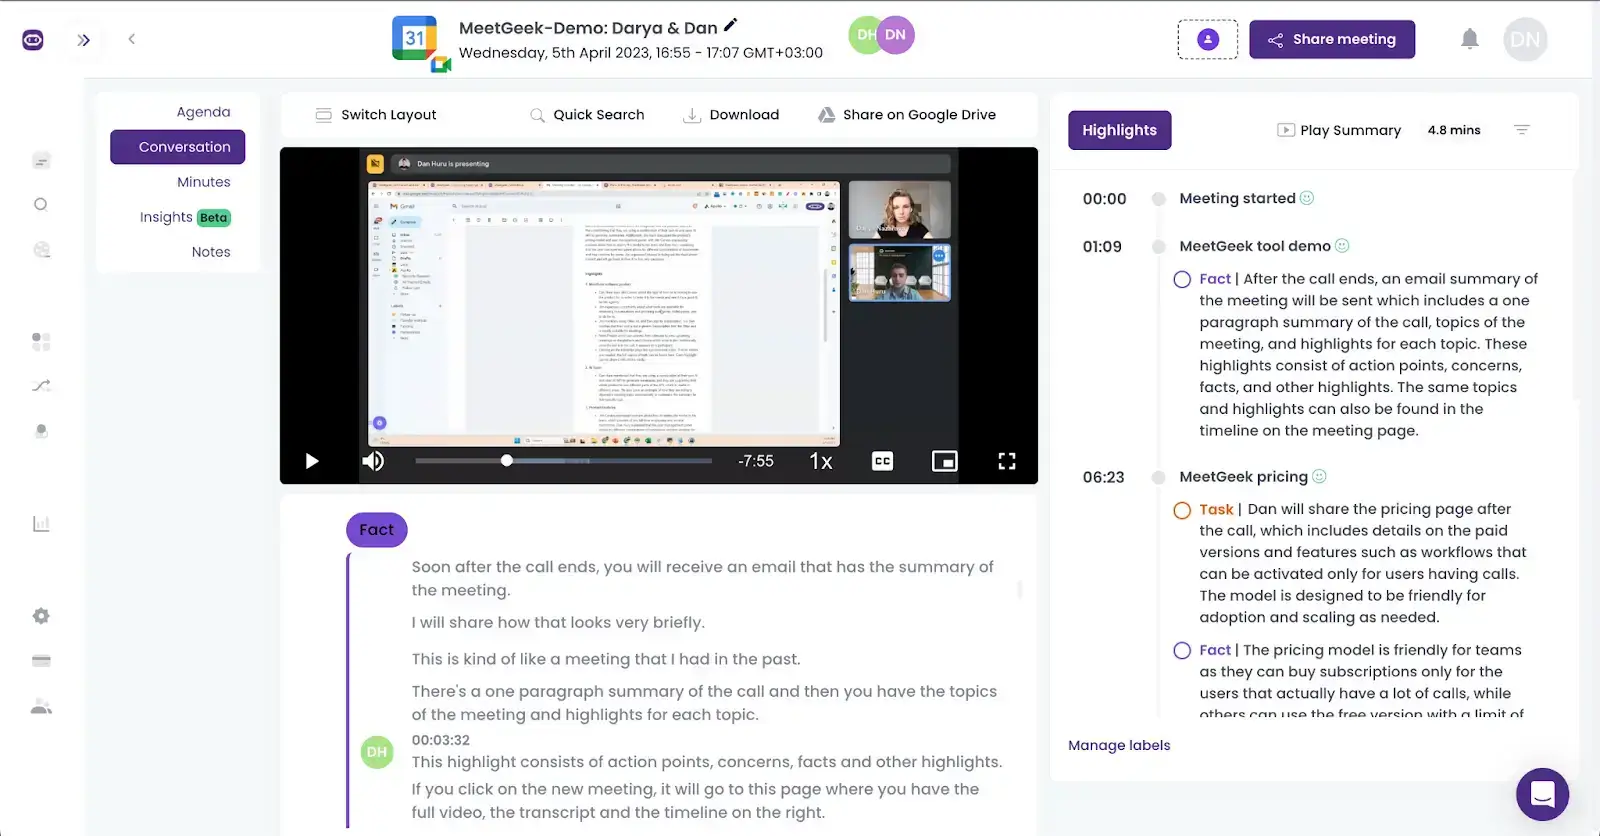
Here’s how MeetGeek sales assistant supports your sales process:
- Automatic recording and transcription: MeetGeek captures your sales calls in over 50 languages, letting your team focus on the conversation without worrying about note-taking.
- AI analytics: Our advanced machine learning algorithms analyze sales calls to provide insights into behavioral trends, sentiment, and performance, helping you identify areas for improvement.
- Targeted coaching: Use recorded calls and detailed transcripts to identify specific areas where sales reps need support, such as refining their negotiation skills or improving product explanations.
- Seamless CRM integration: MeetGeek syncs with platforms like Salesforce, HubSpot, and Pipedrive ensuring sales data and meeting notes are automatically transferred to the corresponding deal in your CRM.
- Collaborative workspace: Team members can access and collaborate on meeting notes, fostering effective teamwork even when not everyone can attend.
- Mobile functionality: The MeetGeek mobile app lets you record, transcribe, and summarize meetings on the go, making it ideal for in-person interactions.
- Centralized repository: Store all meeting-related documents and insights in one secure, easily accessible location for your entire team.
- Customizable meeting templates: Use templates tailored to your business needs to ensure every meeting is productive and goal-oriented.
25. Positive vs. Negative Reply Rates
‘Positive vs. Negative Reply Rates’ tracks the ratio of positive replies (e.g., interest in a meeting) to negative replies (e.g., rejections) from prospects. It allows you to see how well your outreach resonates.
If you receive 30 positive replies and 20 negative ones from 50 total responses, your positive-to-negative ratio is 60:40. A high ratio shows your messaging is effective, while a lower one indicates you need to tweak your pitch or target a more relevant audience.
26. Average Response Time
‘Average response time’ measures how quickly your team responds to prospect inquiries or leads. In fact, did you know that responses that get sent within five minutes can significantly increase the chances of conversion?
For instance, if your team takes an average of 2 hours to reply to leads, but your competitors respond within 5 minutes, you’re probably missing out on a lot of opportunities.
KPIs for Sales and Marketing
27. Customer Lifetime Value (CLV)
‘Customer Lifetime Value’ (CLV) measures the total revenue a customer generates during their relationship with your business. This can help you understand the long-term value of your customers and guide strategies for increasing profitability.
For example, if an average customer spends $500 annually and remains a customer for three years, their CLV is $1,500. To improve CLV, you can focus on upselling, cross-selling, or building stronger customer loyalty programs. This is equally important in B2B eCommerce, where deals are high value and long-term relationships drive sustained revenue.
28. MQL-to-Customer Conversion Rate
‘MQL-to-Customer Conversion Rate’ tracks how many Marketing Qualified Leads (MQLs) convert into paying customers. It shows how effective your marketing efforts are in generating leads that sales can close.
If your marketing team identifies 200 MQLs in a month, and 20 of them become customers, your conversion rate is 10%. A low conversion rate might suggest the need for better lead qualification or stronger collaboration between sales and marketing teams.
29. Customer Retention Rate
‘Customer Retention Rate’ measures the percentage of customers who stay with your business over a specific period. It’s calculated by dividing the number of retained customers by the total number of customers at the start of the period.
For example, if you had 100 customers at the beginning of the month and 90 are still with you by the end, your retention rate is 90%. A high retention rate indicates satisfied customers, while lower rates mean you need to improve customer support or engagement efforts.
30. Net Promoter Score (NPS)
‘Net Promoter Score’ (NPS) measures customer loyalty and satisfaction by asking customers how likely they are to recommend your business to others on a scale from 0 to 10. Customers scoring 9 or 10 are considered promoters, while those scoring 6 or below are detractors.
For example, if 60% of respondents are promoters and 10% are detractors, your NPS is 50. A high NPS shows strong customer satisfaction, while a low score signals areas for improvement in customer experience.
NOTE: Some researchers question if NPS is the best way to predict company growth. They point out that the "likelihood to recommend" question isn’t necessarily better than other loyalty questions, like how satisfied customers are or if they’d buy again. Even with these criticisms, many businesses still rely on NPS for its straightforward approach.
31. Cost Per Acquisition
‘Cost Per Acquisition’ tracks how much you spend to gain a new customer. To calculate it, divide your total marketing and sales costs by the number of new customers acquired.
For example, if you spent $10,000 on marketing and sales and acquired 100 new customers, your CPA is $100. Monitoring this value keeps your spending efficient and aligned with your revenue goals. If your CPA is too high, consider optimizing your campaigns or targeting more qualified leads.
32. Average Revenue Per Account
‘Average Revenue Per Account’ (ARPA) measures the average revenue generated per customer account during a specific period. It’s calculated by dividing total revenue by the number of accounts.
For example, if your business generates $50,000 from 100 accounts in a month, your ARPA is $500. Tracking this metric helps you understand customer value and identify opportunities to increase revenue through upselling or expanding services.
33. Cost Per Lead
‘Cost Per Lead’ measures how much it costs to generate a single lead. It’s calculated by dividing your total marketing spend by the number of leads generated. When every dollar counts, CPL is a great way to see how well your marketing campaign is working.
If you spent $5,000 on a campaign that brought in 200 leads, your CPL is $25. A high CPL might mean you need to optimize your marketing strategies or focus on channels that generate leads more cost-effectively.
What makes CPL so useful is how fast it gives you insights. Instead of waiting for other metrics to show results, CPL lets you see what’s working right away, so you can make quick adjustments and keep your campaign on track.
34. Average Length of Customer Lifecycle
‘Average Length of Customer Lifecycle’ measures the average time a customer spends interacting with your business, from their first purchase to when they stop being a customer.
For example, if most of your customers stay with you for three years, that’s your average lifecycle length. This metric helps you identify trends in customer behavior and assess how well you’re maintaining relationships over time. Shorter lifecycles might indicate the need for better customer engagement or retention efforts.
Change Your Approach to Sales Productivity with MeetGeek!
Remember, it’s not about tracking every number but prioritizing the ones that provide the most actionable data. Use these KPIs as tools to guide your strategy, motivate your team, and ensure your sales efforts are aligned with your broader business goals.
Start small if needed, and adjust as you learn what works best for your organization. With the right approach, you’ll be well-equipped to make this year your most successful one yet and turn your team into the next generation of sales leaders.
If you’re ready to take your sales tracking to the next level, MeetGeek can help. With features like automated recording, transcription, and advanced analytics to track your sales performance in meetings, MeetGeek provides the tools to streamline your sales process, enhance team collaboration, and achieve your goals faster.
.avif)




.webp)


